Overview
RDX (RealUser Digital eXperience) is a Nitrogen module that gives you complete/clear and thorough idea of the experience that your users are getting based on combination of different factors such as: - WVT metrics - Page load time - Volume of requests - Geography of requests - DeviceTypes
This page will give you a basic idea of Page load, volume, experience.
Note: For demo purpose, we will be using www.nviztest.com domain as an example.
Steps
-
Click on
Overviewmenu. Then Select appropriate domain from the domains dropdown.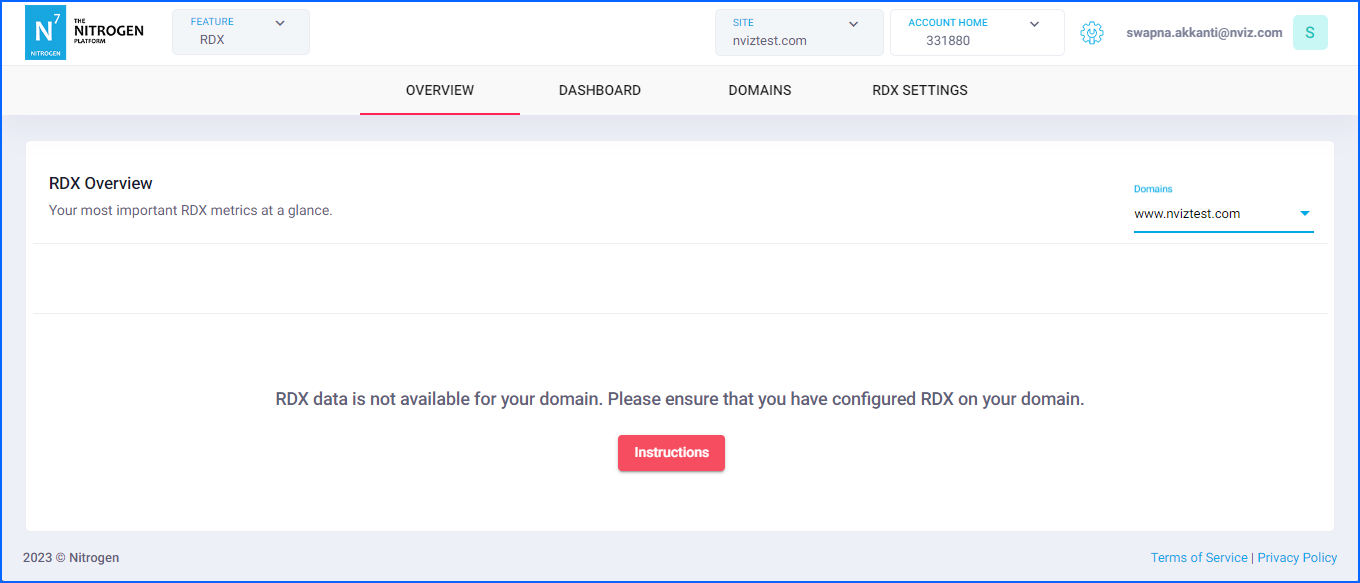
-
If you have not yet enabled the RDX on your domain, you will see a warning.
-
Click on
Instructionsbutton. You will be shown a domain specific script that needs to be injected in the page.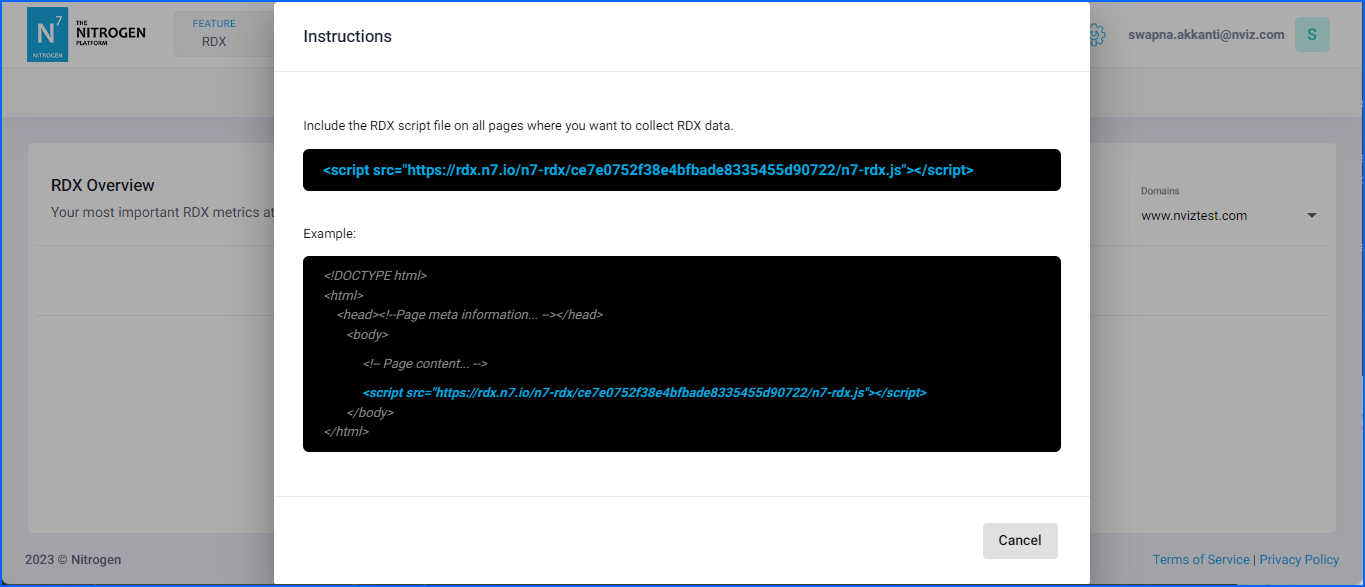
-
Please purge the pages for rdx script change to get live and script to start capturing the performance data.
-
-
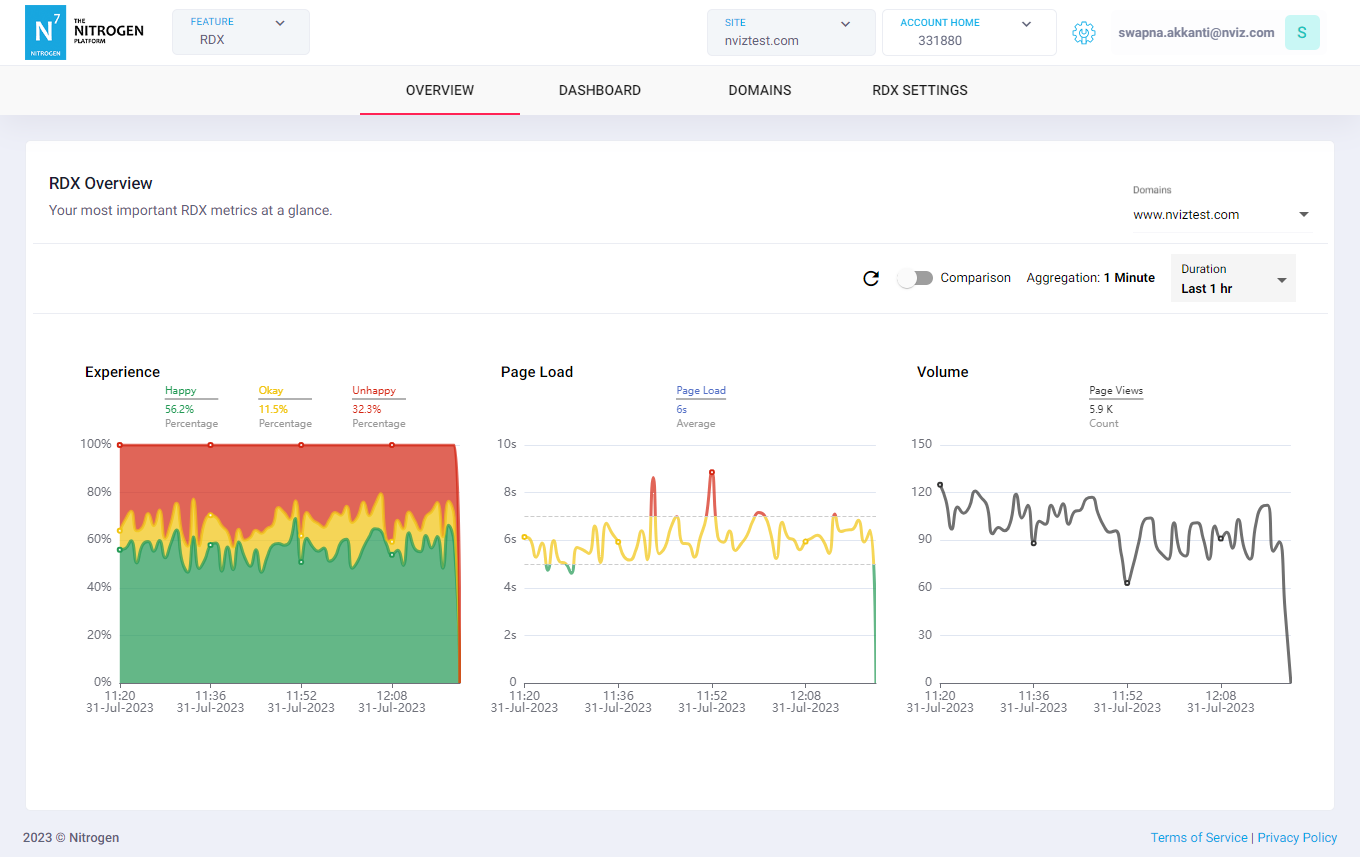
After some time you should be able to see RDX charts showing the basic performance data here.
-
Experience: The percentage of user-happiness-index for all the pages. It is calculated by taking in account of many factors.
Note: You can set it to different values as you desire. Please referRDX Settingsfor this. -
Page Load: The average page load time of all the pages on this domain (cached/non-cache).
-
Volume: The number of requests received on this domain.
-